The Falcon 2000 Series versus the Challenger 604/605 jets
We compare these business jets in the $10.5-32.9m price range and consider payload/range, speed and cabin size and cover current and future market values.
Back to Articles
Mike Chase
Michael Chase owns Chase & Associates, an aviation consulting firm specialized in industry product...

The total fleet of the Falcon 2000 series and Challenger 604/ Challenger 605 business jet fleet is 1,146 aircraft with Bombardier Challenger having 100 more aircraft in operation today (623 units vs 523).
Brief History
Dassault introduced the Dassault Falcon 2000 jet as the Falcon X in 1989. First flight came in 1993, and two years later in 1995 the Falcon 2000 entered service. The Falcon 2000 is a twin-engine business jet. It is smaller than the Falcon 900 tri-jet, and offers transcontinental range. Featuring a large, stand-up cabin, two CFE-738-1-1B GE engines, and a Rockwell Collins Pro Line 4 integrated avionics suite, this aircraft can be RVSM certified when Service Bulletin SB-063 is complied with.
Following the Falcon 2000, the Falcon 2000EX (which received FAA certification in March 2003) offered 25 percent greater range (over 4,000nm) in a six-passenger configuration - while maintaining or improving the other performance qualities that had driven the success of the original Falcon 2000. This improved performance was due to a new powerplant (two PW308C jets totaling 7,480 pounds of thrust) and increased fuel capacity.
Next came the Dassault Falcon 2000EX EASy - offering the new EASy flight deck. This model received US certification in June 2004, and in October 2005 Dassault announced yet another development on the original, in the shape of the Falcon 2000DX. The 2000DX replaced the Falcon 2000, with deliveries underway during 2008, and over 300nm extra range.
The Dassault Falcon 2000EX was replaced by the Falcon Falcon 2000LX jet from 2010 – the 2000LX essentially offering winglets as standard over and above the model it replaced. Finally, the Falcon 2000S was added to the 2000-line-up in 2012.
Payload & Range
The data contained in Table A is sourced from Conklin & de Decker and B&CA’s May 2014 issue. A potential operator should focus on payload capability. The Falcon 2000 series’ ‘Available payload with Maximum Fuel’ has a range from 1,095 to 3,410 pounds, which is generally greater than the Challenger 604/605 (1,263/1,298 pounds).
Cabin Volume
According to Conklin & de Decker, the cabin volume of the Falcon 2000 (1,028 cubic feet) is less than the Challenger 604/605 (1,146 cubic feet).
The differences can essentially be found in the cabin length: the Falcon 2000 series has the greatest length of the study group at 31 feet. However, the Challenger 604/605 cabin length measures 28.4 feet and offers more width at 8.4 feet compared to the Falcon 2000 series at 7.7 feet. It is also interesting to note that the cabin volume of both the Falcon 2000 series and Challenger 604/605 do not change with change from one model to the other. The respective cabin cross-sections are represented, courtesy of UPCAST JETBOOK in Chart A.
Range Comparison
As depicted by Chart B, according to Aircraft Cost Calculator (ACC), usingWichita as a starting destination for the business jets in our field of study, the Falcon 2000EX EASy and 2000LXS show slightly more range coverage than the Challenger 605, while the 2000 and 2000S show less range.
Note: For jets and turboprops, ‘Seats-Full Range’ represents the maximum IFR range of the aircraft at Long-Range Cruise with all passenger seats occupied. ACC assumes NBAA IFR fuel reserve calculation for a 200nm alternate. The lines depicted do not include winds aloft or any other weather-related obstacles.
Powerplant Details
The Falcon 2000 series aircraft (excepting the original 5,918lbst CF34-3B-powered 2000 model) are powered by two PW308C engines each offering 7,000 pounds of thrust (lbst). The Challenger 604/605 offers a pair of General Electric CF34-3B powerplants with 8,729 lbst each.
Cost Per Mile
Using data published in the May 2014 B&CA Planning and Purchasing Handbook and the August 2014 B&CA Operations Planning Guide we will compare our aircraft. The nationwide average Jet-A fuel cost used from the August 2014 edition was $6.18 per gallon at press time, so for the sake of comparison we’ll chart the numbers as published.
Note: Fuel price used from this source does not represent an average price for the year.
Chart C details “Cost per Mile” and compares the Falcon 2000 series to its competition factoring direct costs and with all aircraft flying a 1,000nm mission with an 800 pound (four passengers) payload. The original Falcon 2000 shows the cost per nautical mile from $6.60, which is less than the Challenger 604 ($6.65).
The remaining Falcon 2000-series models all have lower operating costs than the two Challenger 604/605 models. Note, the latest Falcon 2000LX and 2000S models are both significantly less with a $5.03 cost per mile.
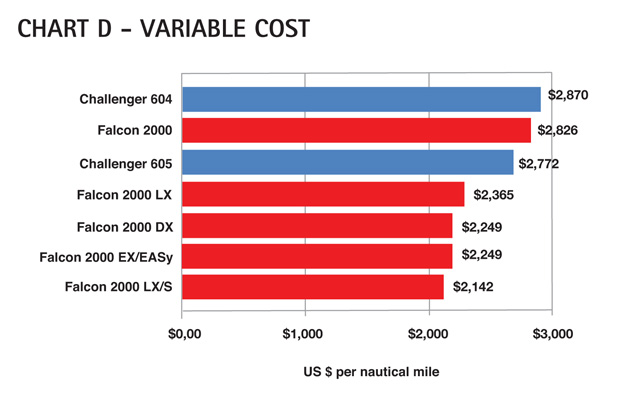
Total Variable Cost
The ‘Total Variable Cost’ illustrated in Chart D is defined as the Cost of Fuel Expense, Maintenance Labor Expense, Scheduled Parts Expense and Miscellaneous Trip Expense. The Total Variable Cost for the Falcon 2000 series shows a high of $2,826 per hour to a low of $2,142 compared to the Challenger 604/605 at $2,870 and $2,772, respectively.
Aircraft Comparison table
Table B contains the average retail prices from Vref for each aircraft. The average speed, cabin volume and maximum payload values are from Conklin & de Decker, while the number of aircraft in-operation and percentage ‘For Sale’ are as reported by JETNET.
The Falcon 2000 series has fewer in operation fleet (over 500 aircraft) compared the Challenger 604/605, but both families’ percentages ‘For Sale’ are in the 5.8% to 7.0% range, representing a traditional seller’s market. Of the 461 wholly-owned Falcon 2000 series in operation (excluding eleven Falcon 2000-series aircraft that are in a shared ownership arrangement and fifty-one in fractional ownership programs), North America is home to 62% and Europe 22% of the fleet (combined 84%).
Depreciation Schedule for Business Aircraft
Aircraft that are owned and operated by businesses are often depreciable for income tax purposes under the Modified Accelerated Cost Recovery System (MACRS). Under MACRS, taxpayers are allowed to accelerate the depreciation of assets by taking a greater percentage of the deductions during the first few years of the applicable recovery period (see Table C).
In certain cases, aircraft may not qualify under the MACRS system and must be depreciated under the less favorable Alternative Depreciation System (ADS) where depreciation is based on a straight-line method meaning that equal deductions are taken during each year of the applicable recovery period. In most cases, recovery periods under ADS are longer than recovery periods available under MACRS.
There a variety of factors that taxpayers must consider in determining if an aircraft may be depreciated, and if so, the correct depreciation method and recovery period that should be utilized. For example, aircraft used in commercial service (i.e. Part 135) are normally depreciated under MACRS over a seven year recovery period or under ADS using a twelve year recovery period.
Aircraft used for qualified business purposes, such as Part 91 business use flights, are generally depreciated under MACRS over a period of five years or by using ADS with a six year recovery period. There are certain uses of the aircraft, such as non-business flights, that may have an impact on the allowable depreciation deduction available in a given year.
Table D depicts an example of using the MACRS schedule for a 2014 model Dassault Falcon 2000LXS aircraft in private (Part 91) and charter (Part 135) operations over five and seven-year periods, assuming a Vref New retail value of $32.9m.
Asking Prices vs AFTT, Age & Engine Thrust
Chart E, sourced from the Multi-dimensional Economic Evaluators Inc., shows a Value and Demand chart for the pre-owned Falcon 2000 series and Challenger 604/605. The current pre-owned market for these aircraft shows a total of 76 aircraft ‘For Sale’ with 29 displaying an asking price, thus we have plotted those 29. The equation that we derived from these asking prices and other criteria used should enable sellers and buyers to compare, and perhaps adjust their offerings if necessary. Demand and Value are on opposite sides of the same Price axis.
The Demand Equation for these vehicles is Price $M = 28.038Qty-0.434. The flat slope (exponent >-1.0) indicates that there is more revenue in the lower portion of the market than there is in the upper. This equation is very well correlated, with an adjusted R2 of 96.7%, a Pearson’s2 of 94.3% a P-Value of 0.16%, and a Standard Error of $2.03m.
The Value Equation is Price = 1.19E-13 *Years Old0.497 *Range1.92 *Max Alt Feet2.92. We find that the Value Equation for these aircraft is well correlated, with an Adjusted R2 of 90.5%, a Pearson’s2 of 92.1%, and a Standard Error of $1.965m (with P-Values of 4.81E-11, 1.1E-05, and 0.01% - and for Years, Range and Max Altitude in Feet respectively).
Thus, the market for used Dassault Falcon 2000s and Bombardier Challenger 604s/605s respond to at least five features: Years, Range, Altitude, Price and Quantity.
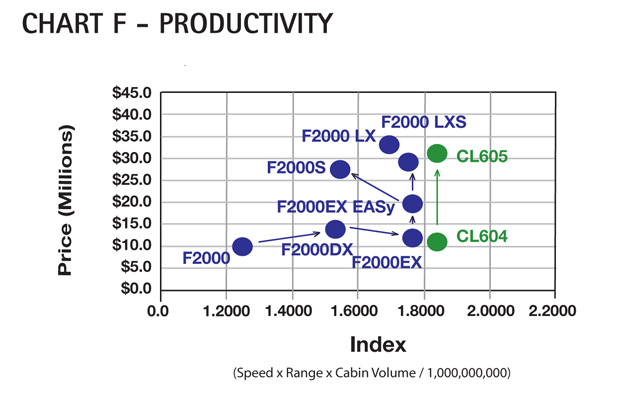
Productivity Comparisons
The points in Chart F center on the same group of aircraft. Pricing used in the vertical axis is as published in the B&CA 2014 Purchase Planning Handbook and Vref. The productivity index requires further discussion in that the factors used can be somewhat arbitrary.
Productivity can be defined (and it is here) as the multiple of three factors:
1. Range with full payload and available fuel;
2. The long range cruise speed flown to achieve that range;
3. The cabin volume available for passengers and amenities.
The result is a very large number so for the purpose of charting, each result is divided by one billion. The examples plotted are confined to the aircraft in this study. A computed curve fit on this plot would not be very tight, but when all business jets are considered the “r” squared factor would equal a number above 0.9. Others may choose different parameters, but serious business aircraft buyers are usually impressed with Price, Range, Speed and Cabin Size.
After consideration of the Price, Range, Speed and Cabin Size, we can conclude that the Falcon 2000 series as shown on the productivity index Chart F is well positioned among the Challenger 604/605 business jets.
Summary
Within the preceding paragraphs we have touched upon several of the attributes that business aircraft operators value. There are other qualities such as airport performance, terminal area performance, and time to climb performance that might factor in a buying decision, too, however.
The Dassault Falcon 2000 series continues to be very popular in the pre-owned market today. Those operators in the market should find the preceding comparison of value. Our expectations are that the Dassault Falcon 2000 series aircraft, which started delivering in 1995, will continue to do very well in the pre-owned market for the foreseeable future.
Read the latest Falcon 2000EX EASy Jet Price Guide with LIVE data and Falcon 2000EX EASy Jet Buyers Guide.
Read the latest Challenger 605 Price Guide with LIVE data and Challenger 605 Jet Buyers Guide.
To see the latest large jets on the market currently, visit Large Jets for sale
Read More About: Large Jets | Jet Comparisons

Mike Chase
Michael Chase owns Chase & Associates, an aviation consulting firm specialized in industry product and market research in the Commercial & Business Aviation sectors.
With over five decades of extensive experience, Michael has worked as a director of special projects for JETNET, LLC; served as Senior Management Consultant for Sabre Holding; and was Director of Market & Sales Research for Gulfstream Aerospace, leading sales and product research, including feasibility and viability studies.
